


Author
Ahmed Balaha

Author


Share


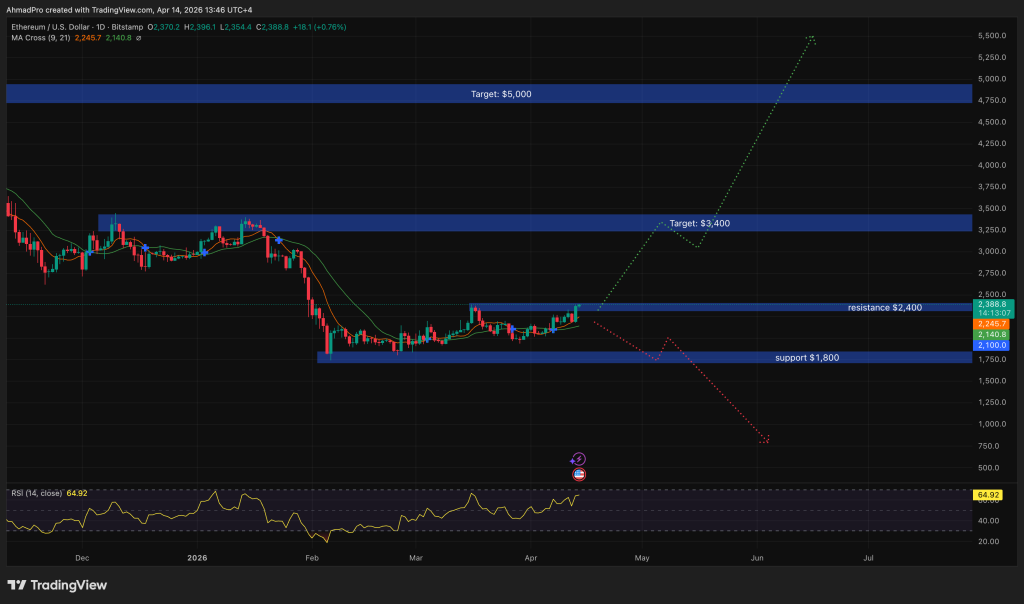
Ethereum price is trading at $2,355 in April 2026, up 8.09% on the monthly chart after the $2,000 monthly low was tested and held a multi-year ascending support trendline connecting every major ETH bear market bottom since 2019.
The bounce is in progress. What traders are now watching is whether it has structural legs or simply marks a temporary reprieve before the next leg lower.
Ethereum Price Prediction: Multi-Year Trendline Holds, But Can ETH Reclaim Its SMAs?
The ascending support trendline on ETH’s monthly chart is not a recent construction. It connects the 2019 base, the 2020 pre-rally accumulation zone, and the 2022 cycle bottom, making it the deepest and most tested structural floor in Ethereum’s price history.
The April monthly candle printed a long lower wick at that trendline, a candlestick structure that signals demand absorption at scale. Price has since recovered to the $2,400 area, forming a positive monthly body above the line.
The monthly MACD (12,26,9) adds the critical secondary signal. The MACD line sits at -29.45 and the signal line at, 159.35, producing a histogram reading of positive 129.89, the first positive monthly histogram since Ethereum’s descent accelerated from its August 2025 high near $4,800.
Both lines remain in negative territory, meaning the macro trend has not reversed. But a histogram turning positive at a multi-year trendline test is historically consistent with momentum inflecting before price does on the longer timeframe. The chart is mending. It hasn’t healed.
On the upside, two SMAs define the recovery corridor. The SMA 50 at $2,440.86 is the immediate resistance and the first target that would shift the moving average ribbon from fully bearish.
The SMA 20 at $2,857.71 is the extended objective, a return to where both SMAs converged before the 2025 breakdown. This broader technical structure in Ethereum long-term price chart has historically preceded significant recoveries when macro momentum aligns with structural support.
The buy walls flanking the $2,000–$2,100 zone are supported by on-chain data.
CryptoQuant contributor Arab Chain reported that whales withdrew over 120,000 ETH from centralized exchanges in early March, the largest single outflow since October 2025, a pattern consistent with accumulation near structural support rather than distribution.

Exchange reserves hit multi-month lows as that supply moved off-platform, compressing available sell-side liquidity precisely where the trendline sits.
Perpetual futures showed a slightly positive funding rate as of April 12, indicating measured but persistent long-side demand. The Ethereum Foundation staked 45,000 ETH on April 5, targeting a total of 70,000 ETH, generating an estimated $3.9 to $5.4 million annually in yield while removing immediate circulating sell pressure.
Crypto analyst Leshka posted on X that ETH “will 3x-4x in the next six months,” citing the developing supply squeeze as evidence of a structural base forming – a view that gains more grounding with the monthly MACD now confirming improving momentum.
Ethereum’s Glamsterdam upgrade, scheduled for H1 2026, adds a forward catalyst: targeting a significant gas limit increase, parallel transaction execution, and enshrined proposer-builder separation that is expected to materially reduce Layer-2 costs.
Invalidation is unambiguous. A monthly close below $2,017.09 breaks the trendline outright and shifts the macro structure bearish, with $1,500 the next level of consequence.
Discover: Macro context shaping crypto technical setups right now
Liquidchain Targets Early-Mover Upside as Ethereum Tests Key Levels
ETH’s recovery potential is real – a move from $2,255 to the SMA 20 at $2,857 represents roughly 27% upside from current levels. For a large-cap asset with a market cap measured in hundreds of billions, that’s a meaningful return. The mathematical ceiling, however, is what it is.
Traders seeking asymmetric exposure at this stage of the cycle are increasingly looking at early-stage infrastructure projects positioned around Ethereum’s scaling roadmap.

Liquidchain (LQC) is one project drawing attention in this context, a Layer-3 execution environment designed to aggregate liquidity across Ethereum and its rollup ecosystem, with a technical architecture specifically targeting the throughput bottlenecks that Glamsterdam addresses at the base layer.
The presale has raised over $660K at a current token price of $0.0147, with staking rewards available to early participants.
The project’s core differentiator is its unified liquidity routing across fragmented L2 environments, a structural problem that grows in relevance as Ethereum’s rollup ecosystem expands post-Glamsterdam. Presale investments carry real risk, and this is an early-stage L3 infrastructure project with meaningful execution uncertainty. DYOR applies unconditionally.
Explore the Liquidchain presale here
Trending News
RecommendedPopular Crypto TopicsPrice Predictions

Be the first to comment